TSA body-scanner policy change. Looking at city smog levels worldwide
This item appears on page 2 of the February 2016 issue.
Dear Globetrotter:
Welcome to the 480th issue of your monthly foreign travel magazine.
Divide that number by 12 and you’ll see that, with this issue, ITN has been in publication for 40 years!
ITN depends on its subscribers, each of you, to write in about interesting places to visit, ways to travel more cost- or time-efficiently, things travelers should watch out for — whatever may interest people who travel anywhere outside of the US.
For submitting trip reports, spreading the word about ITN, utilizing ITN advertisers or simply subscribing, thank you. You have helped this group project to be a success.
We’ll continue to give back in the only way we know how, by sharing travel information. Here’s an item to get things started.
The US Transportation Security Administration (TSA) has made an adjustment to its airport security screening policy. As of Dec. 18, 2015, in US airports equipped with full-body scanners, some passengers — at the discretion of individual TSA agents — no longer may be able to choose a pat-down rather than go through the scanner.
The TSA has not said which categories of passengers will not be able to choose a pat-down, only that, for some passengers, the scanner will be “mandatory.”
The TSA began installing full-body scanners in airports in 2007. Most of them are known as millimeter-wave machines, and they emit low-level electromagnetic waves that can penetrate clothing and reflect off objects. When someone stands in the scanner, the image of his body underneath his clothing, along with any objects he is carrying, appears on a monitor.
Despite the TSA’s assuring people that the images would not be saved nor visible to the public and that the person viewing them would not be in the same room as the person being scanned, some people have been uncomfortable having their images recorded in this way. Until now, they could opt for a physical pat-down that could be done in a private room. No longer will they always be offered this alternative.
The TSA claims that the privacy concerns have been dealt with. With today’s full-body scanners, the graphic images of people being scanned no longer appear. Instead, only a generic “body” is shown on the screen, with the general locations of any potential foreign objects highlighted, signaling the need for further investigation (such as with a pat-down) by a TSA agent.
A passenger uncomfortable with the full-body scanner still can request a pat-down instead, but he should be prepared for the possibility that his request will be denied.
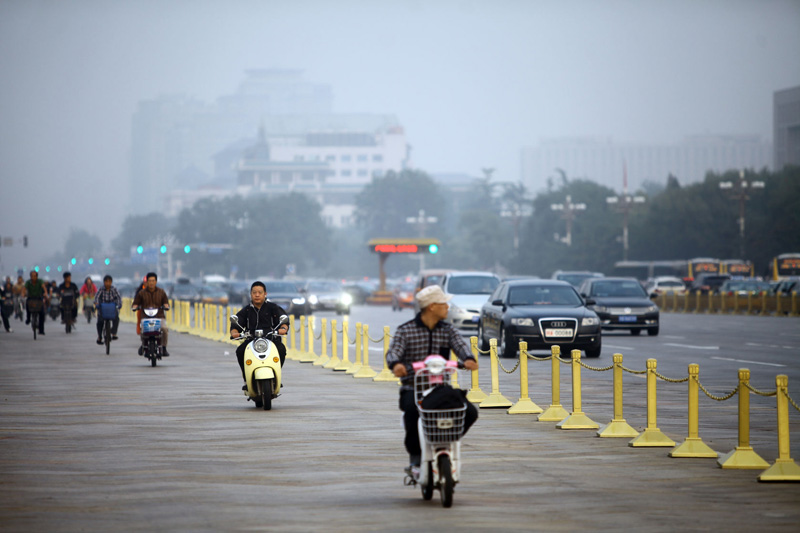
In China, for five days during the end of November and the beginning of December, 30 cities around the capital city of Beijing suffered from extreme smog, most of it produced by coal-burning power plants. On Dec. 1, air quality in Beijing was so bad that officials limited city traffic and industrial output and ordered schools to keep children inside. Another 5-day smog alert was issued starting on Dec. 18.
Specifically, on the smoggiest days in and around the city, the levels of PM10 particles suspended in the air — that is, particulate matter with a diameter of less than 10 microns, a size just over 1/8th the width of a human hair (pollen and dust fall in this category) — reached 250 micrograms (written as “250μg”) per cubic meter of air (m3).
The World Health Organization, or WHO, considers average PM10 levels at or higher than 20 micrograms per cubic meter of air (20μg/m3) to be “unsafe” and any readings of 50μg/m3 or more to be “dangerous.”
When gauging air pollution, environmental agencies gather air samples over a 24-hour period and average out the readings for the daily level. In addition to measuring levels of PM10-sized particles, they also track the levels of particles measuring 2.5 microns in diameter (PM2.5), about 1/30th the width of a human hair. The smaller particles are considered the more hazardous pollutants. That’s because they can get sucked deeper into one’s lungs and thus are more difficult for the body to get rid of.
As for PM2.5-sized particles, WHO considers any 24-hour average concentration of 10μg/m3 or more to be “unsafe” and any average of 20μg/m3 or more to be “dangerous.”
Thus, WHO recommends that cities each try to keep their average annual levels of PM2.5-sized particles to less than 10μg/m3. In the US, where standards are set by the Environmental Protection Agency, a measurement of 12μg/m3 or less is considered safe. Maximum levels are less strict in the European Union (EU), however, where any level of PM2.5 under 25μg/m3 is considered safe.
• WHO has a database online showing what the pollution levels have been in more than 1,600 cities worldwide. Each city’s listing shows the measured mean (average) — the daily readings divided by the number of days on which readings were taken — in one of the years from 2008 to 2014. (To download the database, visit www.who.int/phe/health_topics/outdoorair/databases/cities/en and, to the right, click on “Ambient [outdoor] air pollution database, by country and city.”)
The database does not include details on which days of the year or in which seasons measurements were taken in each city, but it does show on how many days readings were taken and the year it was last done.
Something to note — measuring for PM2.5-sized particles under WHO standards, about 30% of cities in the US did not fall within recommended safe air pollution levels. If going by US standards, about 13% of US cities did not meet recommendations. If measuring US cities by EU standards, only one, Fresno, California, failed to meet the standards.
On the other hand, still measuring for PM2.5, a shocking 93% of European cities did not fall within safe air pollution levels under WHO standards. Daily readings there averaged 21.7μg/m3.
• So just how smoggy are some of the cities in Europe? Using WHO’s online listing, I thought I would share a few of the averaged daily smog levels.
For each of the cities, I’ll show the average concentrations of both sizes of particulate matter in the air, the nasty PM2.5 particles first (in bold italics font; for example, 13μg/m3 in Oslo, Norway), then the level of the chunkier PM10 particles (just in bold; for Oslo, it was 23μg/m3).
As you’ll see, the concentrations of both sizes of particles do not always correlate; some places can be heavy in one but not the other. Choose your poison.
So here we go for pollution levels in 10 more EUROPEAN CITIES:
London, 16μg/m3/22μg/m3;
Barcelona, Spain, 16/25;
Firenze, Italy, 16/25;
Paris, France, 17/24;
Amsterdam, Netherlands, 18/25;
Brussels, Belgium, 18/27;
Genève, Switzerland, 18/27;
Berlin, Germany, 20/24;
Moscow, Russia, 22/33, and, highest in Europe for both levels, it was
Pernik, Bulgaria (12 miles southwest of Sofia), 52/74.
(One European city notorious for its air pollution, Athens, was not included in the listing.)
On March 23, 2015, the air in Paris was so smoggy (PM10 at 40μg/m3-55μg/m3) that, in order to reduce pollution levels, city authorities enacted a one-day ban on cars with license plates ending in even numbers. The same thing happened a year earlier on March 17. (During each ban, public transportation was free.)
To give you a frame of reference with readings in familiar places closer to home, these were the averaged PM2.5/PM10 levels in some US CITIES:
Portland, OR & Vancouver, WA, 7μg/m3/12μg/m3;
Boulder, CO, 7/12;
Dallas/Ft. Worth, TX, 12/20;
Chicago, IL, 13/22;
New Orleans/Metairie/Kenner, LA, 13/21;
New York/Long Island, NY & northern NJ, 14/23;
Indianapolis/Carmel, IN, 15/25;
Phoenix/Mesa/Scottsdale, AZ, 16/26;
Philadelphia/Camden/Wilmington, PA, 17/28, and
Los Angeles/Long Beach/Santa Ana, CA, 20/33.
The following were the average PM2.5/PM10 levels in well-known cities in a dozen countries ELSEWHERE IN THE WORLD (which had, admittedly, comparatively high readings):
Bangkok, Thailand, 20μg/m3/38μg/m3;
México, D.F., Mexico, 25/93;
Rio de Janeiro, Brazil, 36/67;
Lima, Peru, 38/63;
Ankara, Turkey, 39/58;
Hanoi, Vietnam, 39/86;
Johannesburg, South Africa, 51/98;
Beijing, China, 56/121;
Ulaanbaatar, Mongolia, 68/148;
Cairo, Egypt, 73/135;
Karachi, Pakistan, 117/273, and
Delhi, India, 150/286.
When I wrote about this subject back in the May 2014 issue, I named the most polluted cities in the world, including, in the number-one position, Ahwaz, Iran. According to WHO’s current online list, Ahwaz’s average PM2.5 level was 70μg/m3; however, its PM10 level exceeded 300μg/m3!
The city with the highest PM2.5 level on the chart is Delhi; measured in 2013, its 150μg/m3 was 15 times higher than what WHO considers safe. (According to WHO, pollution contributes to over 600,000 premature deaths in India each year.)
The city shown with the highest PM10 level was Peshawar, Pakistan, which was last measured in 2010 at a lung-aching 540μg/m3.
Granted, the pollution levels listed above are not constant and will vary with weather conditions and season, but, for your next trip, you might want to keep them in mind (along with a dust mask in your carry-on).
Way back in our December 2013 issue, we printed an account of a tour of Ethiopia gone bad. Gail Riba of Wimauma, Florida, along with her husband and daughter, had paid Daniel Damtew Aseffa of Glory Ethiopia Travel & Tours (Addis Ababa, Ethiopia; www.glo.ethiopia travel.com.et) for a private tour, Jan. 16-Feb. 1, 2013.
As it turned out, they missed much sightseeing because the minivan in which they were driven by Mr. Damtew broke down often, they did not stay in the expected hotels in southern Ethiopia, and, after flying to northern Ethiopia, they had to pay again for all further arrangements because Mr. Damtew had not paid the local tour operator or hotels there.
By October of that year, Mr. Damtew had been arrested, and upon his release he had started paying back an agreed-upon $4,196 to the Ribas in installments, having made one payment of 20,000 Ethiopian birr (about $1,000). His trade license had been suspended.
ITN kept in contact with Ms. Riba, learning that further payments were slow in coming. Ms. Riba continued to email her contact at Ethiopia’s Ministry of Tourism every six to eight weeks and refused to agree to dropping the charges against Mr. Damtew.
In late April 2015, upon Ms. Riba’s request, her contact sent her the email addresses of officials in certain government agencies, to whom she subsequently sent copies of an email expressing her dissatisfaction that Mr. Damtew was not being held accountable for his crimes and might even get his license back. Within three weeks, Ms. Riba had been reimbursed the full amount owed by Mr. Damtew.
For all to know, Ms. Riba wrote, “I would emphasize that Mr. Damtew is not indicative of all Ethiopian tour guides and tour companies. We did meet nice people in the tourism industry in Ethiopia.
“For example, aside from those whose help I cited in my letter in ITN, there was an excellent guide in the Semien Mountains named Solomon, who refused to take our tip because of what had happened to us and who stayed in touch with us by email to see if we had received the help we deserved.
“Just because we ran into a bad apple does not mean people should not travel to this interesting country. Be aware, however, that you should travel with a reputable tour guide and/or organization.”
A CLARIFICATION —
In the feature article on Tanzania that appeared in the November 2015 issue, the reference to the Democratic Republic of the Congo, or DRC, on page 42 might have caused some confusion.
In describing his stay at the Kungwe Beach Lodge near Mahale, Tanzania, the author wrote, “The 10 bandas, or cabins, were strung out along the beach looking westward toward the lights of the Congo (Kinshasa), which were visible at night.”
Colloquially, the DRC is referred to as “Congo-Kinshasa,” so the text in the parentheses was there to differentiate the country whose capital is Kinshasa from the smaller Republic of the Congo (often called “Congo-Brazzaville,” referring to its capital) rather than to refer to the city of Kinshasa, itself.
I thank Albert Podell of New York, New York, for bringing this to our attention, giving us the opportunity to make this clarification.
Working on a foreign language? Here’s a bit of advice from nonagenarian George F. Mueden of Providence, Rhode Island: “For our travels in Italy, my friend Louise used a method of vocabulary building that is worth mentioning. She read the world’s great novels in Italian translation and looked up new words the third time she saw them.”
We’re getting lots of entries for our “Where Were You in 2015?” informal poll and prize drawing.
If you are an ITN subscriber, write up a list of all of the nations you visited in 2015 outside of your country of residence and email it to editor@intltravelnews.com or address it to Where Were You in 2015?, c/o ITN, 2116 28th St., Sacramento, CA 95818. Include your mailing address (where you receive ITN).
It’s good for us to know where our subscribers have been traveling, and after the (fast-approaching) deadline for entry, March 31, 2016, we’ll have a random drawing and send out a number of prizes.
I’ll announce the poll results and the prize winners here in the June 2016 issue.
Judith E. Just of Lompoc, California, wrote, “I love my ITN! There is no other magazine that, upon its arrival in my mailbox, I sit down and ‘devour,’ cover to cover. Thanks!”
Natalie Reciputi of Minneapolis, Minnesota, renewed her subscription and wrote, “ITN has spoiled me for any other travel magazine. Thanks!”
And Mary Darmstaetter of Boston, Massachusetts, wrote, “As a longtime subscriber to ITN, I was singing its praises on a recent trip to the Baltics with Gate1 Travel. Please send a complimentary copy to this fellow group member.” Mary included the person’s name and address.
We’ll mail a free sample copy of the next-printed issue to any of your friends who enjoy international travel. Just send us their names and addresses, which we do not sell, trade or pass along to any other firm (except the company handling our subscriptions).
To her note, Mary added, “Keep up the great work. ITN’s articles are fabulous, and I have found some good trips via your advertisers.”
ITN has many longtime advertisers. Don’t overlook them when planning your next trip.